Adam Lashley

I'm a Master's of Data Science student graduating in 2022.
Through my demonstrated history of developing end-to-end data solutions, I have developed a variety of transferrable skillsets in the areas of computer vision, deep learning, and natural language processing. I enjoy collaborating in teams and developing novel solutions to challenging problems.
View My LinkedIn Profile
Covid Map Webapp
November 2020 – with Sara Haman
Project Objective:
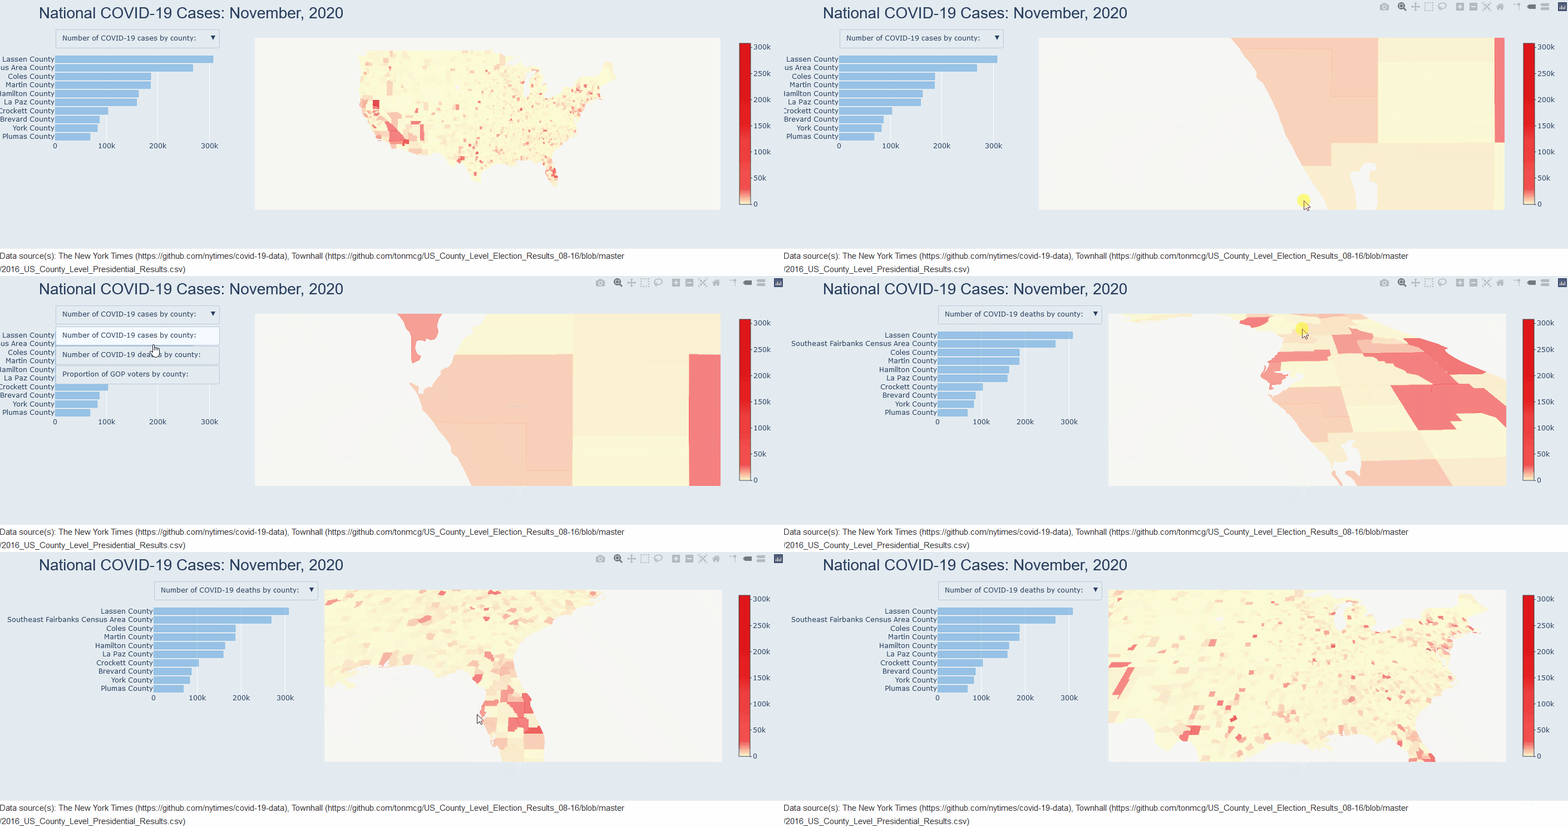
- Our goal was to create a Covid dashboard to allow users to track the Covid pandemic in the United States at a county level.

Tools Used:
- Python
- Plotly
- R
- PSQL
Frontend:
We developed a plotly choropleth map of the United States to enable users to easily visualize outbreak trends at a county level.
The county vectors are drawn on a plotly globe based on values in a geo-JSON file and are merged with respective county covid data by FIPS code.
Example map object:
Types = ['Cases','Deaths']

for q in Types:
    trace1.append(go.Choroplethmapbox(
        geojson = countyData, # County vectors
        locations = df['FIPS'].tolist(), # FIPS code
        z = df[q].tolist(),
        colorscale = pl_deep,
        text = counties,
        colorbar = dict(thickness=20, ticklen=3),
        marker_line_width=0, marker_opacity=0.7,
        visible=False,
        subplot='mapbox1',
        hovertemplate = "<b>%{text}</b><br><br>" +
                "Number of "+str(q)+"=%{z}<br>" +
                "<extra></extra>"))
Backend:
We utilized a normalized PSQL database to store and update our county covid data. The database was designed to automatically scrape, clean, and update case numbers on a daily basis.
Example call to the database to update map data:
def retrieveData(month):
    '''
    Connects to the covidPolitics database.
    Merges the data on FIPS code and returns the merged df.
    '''
    conn = pspg.connect("dbname=covidPolitics user=alashley")
    cur = conn.cursor()

    cur.execute("select * from covid where date = "+str(month))
    covid_pull = list(cur.fetchall())
    df = pd.DataFrame(covid_pull, columns =['Date', 'County',
        'State', 'FIPS', 'Cases', 'Deaths'])

    conn.close()

    return df
For more details and the full source code check out my GitHub!